Today I’d like to talk about identifying comorbidities within the PPMI dataset. Comorbidities are any condition which exists alongside the primary disease, and can include those that often occur in concert with PD, such as anxiety, depression, REM sleep behavioural disorder, daytime sleepiness, and bowel and bladder dysfunction. There are other conditions which are less strongly linked with PD, although we could speculate a mechanism by which they share an origin, such as autonomic dysfunction causing hypertension. And there are many diseases for which there appears to be no link or common mechanism, such as cancer.
When sub-typing Parkinson’s, or looking for common patient journeys through the disease, the clusters of comorbidities can be illuminating. For this reason, I started digging into the comorbidity data within PPMI, with the goal of creating a table of data for the PD and Healthy Control patients which could be used as part of a clustering process.
Where are comorbidities in PPMI?
There are three tables in PPMI which touch on comorbidities:
- General physical exam: This identifies the body part where a clinician found an “abnormality”. Data is recorded using a controlled ontology with terms such as skin, lungs, psychiatric, or neurological.
- Concomitant medications log: This identifies all non-levodopa-equivalent medications prescribed, with a controlled ontology for the indication.
- Other clinical features: This table identifies features often associated with PD, using a controlled ontology with terms such as depression, anxiety, cognitive fluctuations, and dyskinesia.
Note, there is another table called the Medical Conditions Log, which contains two fields. The first is a free text field, which is difficult to regularize because it doesn’t use a controlled ontology. The second identifies a hospital department or category, such as “dermatological” or “pulmonary”, but I found the meaning of this table hard to discern from the documentation. As a result, I focused on the three tables listed above.
Correlation between data tables
So the general physical exam, concomitant medications, and other clinical features all give a view into comorbidities, and we might expect overlap or agreement between them. For example, the medications ontology contains “Anxiety”, the clinical features records the presence of anxiety (FEATANXITY), and the physical exam records psychiatric conditions. If someone experiences anxiety, we may expect this to be recorded across all three data columns.
However, this is not always the case! The table below shows the Pearson correlation coefficient calculated for the pairwise comparison of these three columns. We can see that there is relatively low correlation, ranging from 0.13 between the feature and general physical exam, up to 0.32 between medication and general physical exam. We may have a priori expected a value closer to 1, representing higher correlation.

It’s not just psychiatric conditions which display relatively low concordance. The table below shows correlation between medications for constipation, the feature of bowel dysfunction (FEATBWLDYS), and gastrointestinal abnormality on the physical exam. The correlations are even lower here than for anxiety! Of course, there are more types of bowel dysfunction than just constipation, and more types of gastrointestinal abnormality than just bowel dysfunction, but the highest correlation is actually between gastrointestinal abnormality at physical exam and medication for constipation.

This pattern repeats for all other comorbidities which are covered by two or more of these three data tables. My interpretation is that not all conditions are under treatment, not all conditions are medicated, and not all symptoms are present at physical exam. As a result, a given comorbidity may be captured by only one or two of the data tables.
Representing comorbidities
If we want to include comorbidities within analysis or modelling, it may be more useful to consider these three data tables as giving hints towards a “tendency to comorbidity” rather than a binary presence/absence. Since there is no perfect overlap of ontology terms between the three sources (ie bowel dysfunction is more than just constipation), we can’t simply combine categories with a voting scheme. An alternative approach is to perform Principal Component Analysis (PCA) on all three data tables, to uncover the principal components of comorbidity within the data.
When I did this, I discovered that 30 components explained 90% of the variance within the data (see below). Including 30 features within a machine learning model is better than including all 76 of the raw data columns, as the information content within a given component is higher, and the ML model is more likely to correctly determine the relationship between the input and the outcome being predicted.

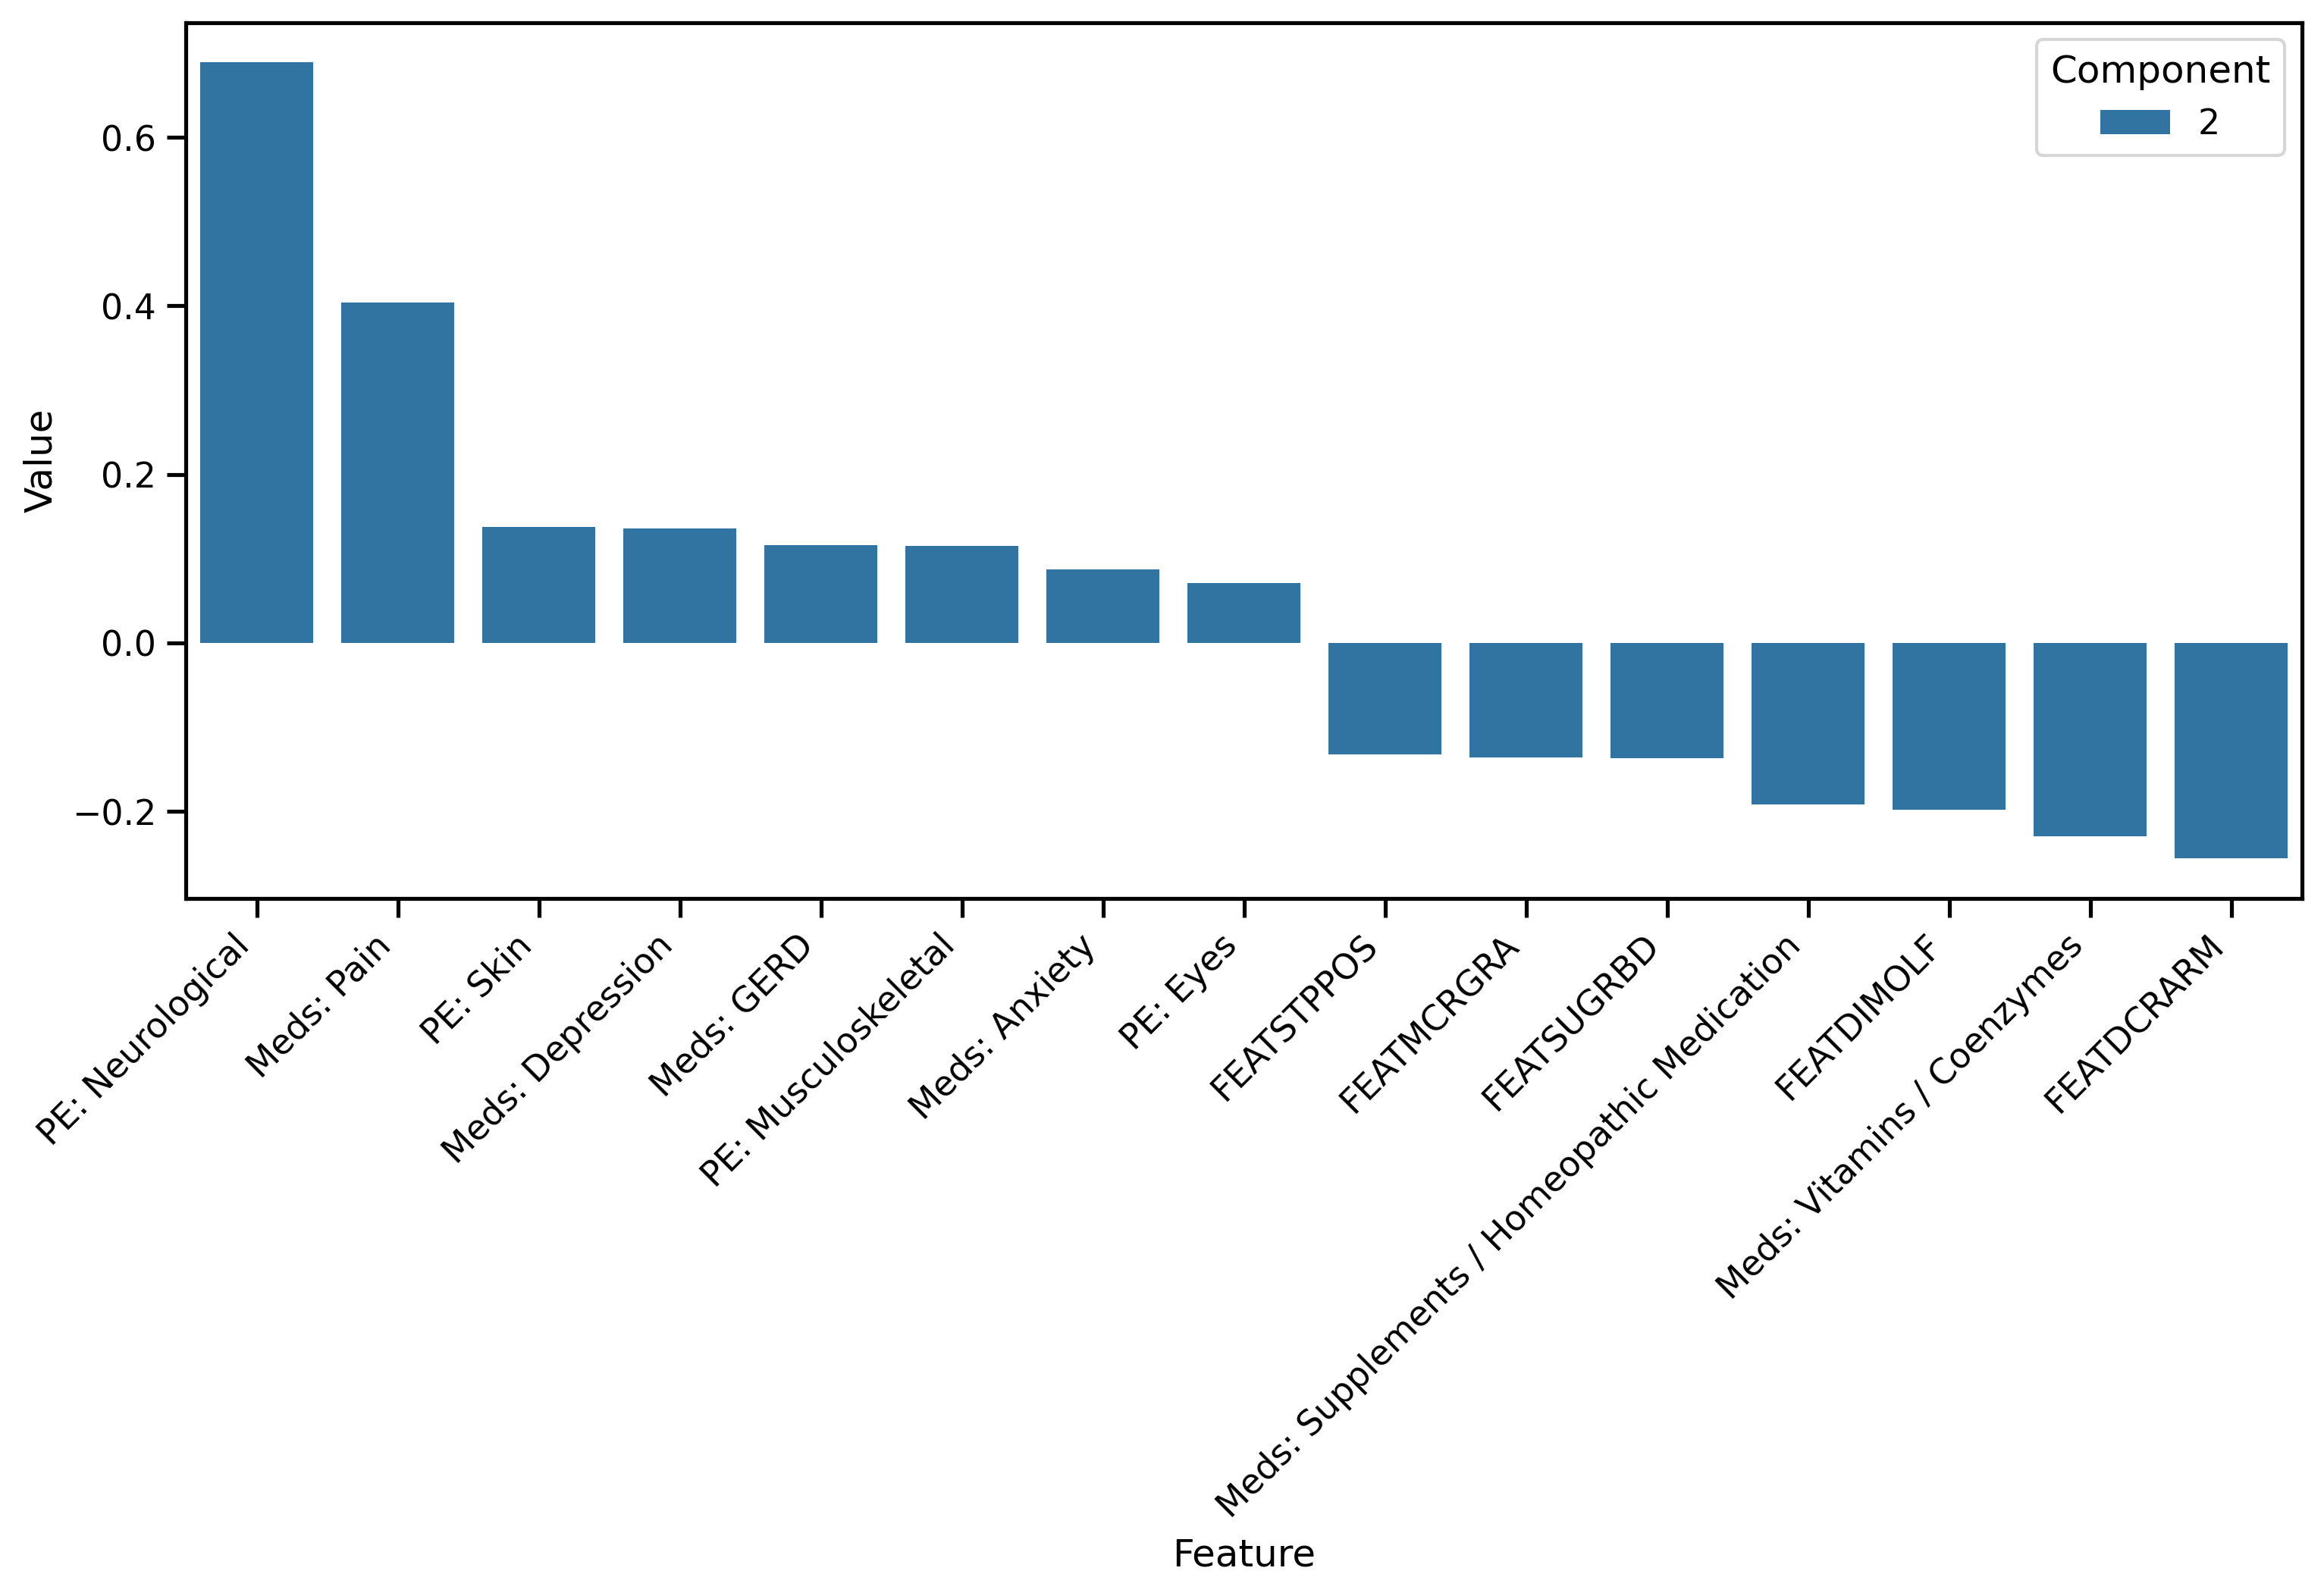
As a final step, we can examine the loadings on each input feature that comprises a given component. In this way we can uncover some meaning behind the component. For example, the plot below shows that component 2 is driven primarily by a neurological abnormality at the physical exam (PE: Neurological), and medications for pain.
Summary
Comorbidities may be a crucial element of understanding sub-types of Parkinson’s, but there are multiple data tables in PPMI which give a view on whether or not a given comorbidity is present. Instead of focusing only on medications, physical exam, or other clinical features, we can combine all three together using PCA, and select only the components which explain the most variance within the data. In this way, we can capture more nuanced information about comorbidities, and hopefully unlock deeper understanding of Parkinson’s.
What do others think? Have you worked with comorbidities in PPMI? How did your thinking and workflow differ? Please let me know below!