Hello everyone, I wanted to share some first impressions regarding the PDMB Microbiome sub-study data and check with you if these are correct. First, regarding the available (Cutadapt pre-processed) raw data, these are the sample numbers we see:
| phenotype | origin | fecal | saliva | both (%) |
|---|---|---|---|---|
| NT | 23&ME participant | 295 | 294 | 99.0 |
| NT | PDMB, main | 23 | 22 | 95.7 |
| NT | total | 318 | 316 | |
| PD | PDMB, main | 350 | 349 | 98.0 |
| PD | PDMB, no response | 17 | 15 | 88.2 |
| PD | PDMB, pilot | 37 | 37 | 94.7 |
| PD | total | 404 | 401 |
It looks non-PDMB controls were sourced from 23&Me, because indeed within the PDMB sub-cohort, there are not many neurotypical (NT) controls. This indeed balances the two phenotypes nicely, but it seems no subject metadata is available at all for these NT controls? Would it be possible to source gender, age, eventually BMI? As mentioned in the table, a handful of PDMB participants do not have PDMB specific metadata associated, so presamably, these subjects have not responded to the PDMB questionnaire.
Next, it seems we can confirm the raw data was indeed pre-processed as mentioned in the FoxInsight Nature Scientific Data paper, because we do not detect adapters. We can still infer library insert size, by looking at the resulting mean read length per sample. Shorter (trimmed back) read length with Illumina sequences is generally indicative of detected adapter much more than of read quality, especially on the forward read - which is the only read available here, since this is 1x100bp single-end sequencing data. Another quality control aspect we look at is PCR duplicates, which we remove prior to read classification. We obtain the following QC plot:
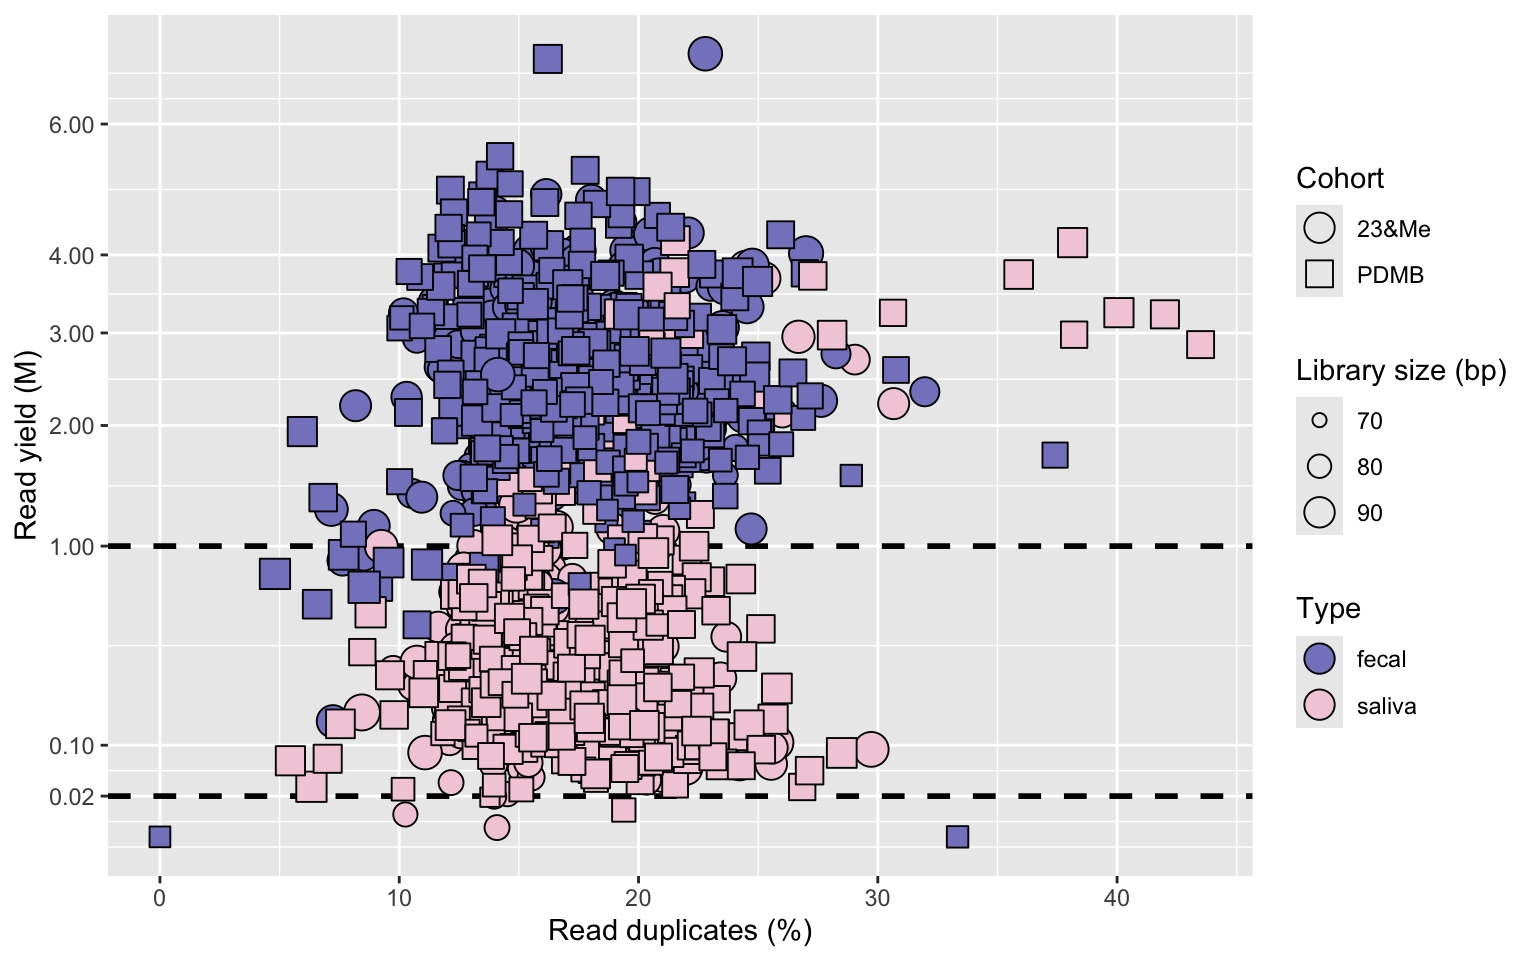
This confirms the microbiome data is indeed shallow but not dramatically - for the fecal samples we are at about a factor 10 of what we usually sequence, with ~3M reads/sample. PCR duplicates seem well controlled overall, but perhaps surprisingly comparable between fecal and saliva, whereas only saliva represents low biomass. The more extreme duplicate read samples are indeed situated on the side of the saliva. The indicated read number thresholds, 20k reads for saliva and 1M for fecal, is what we intend to use for downstream rarefaction on a dataset like this, to perform alpha diversity analysis. And thus eliminate the corresponding outliers. A few saliva samples below the threshold also have low mean read length, indicative of degraded DNA input to the library construction, but overall the DNA quality seems to have been very usable or perhaps a good small fragment cleanup was used.
Voilà, our first impressions with the microbiome dataset, I hope this is useful for the community and that we can get some additional metadata for the NT controls as mentioned - presuming our interpretations are correct of course.