Hello everyone,
Yes, I know… I’ve been away for a while, and maybe some people are thinking, “Did the memes and the Santos Dumont incident finally make people invite Thiago to leave DCOP?” To those people, I say: “I’m still here!”
The first Brazilian Oscar (and no, I won’t bring up the Central do Brasil incident) finally arrived in 2025. Maybe the first Nobel, NBA championship, or NFL championship will be next!

But I’m not here to talk about Fernanda Torres (Os Normais is awesome), but about something almost as exciting: Phasing and Imputation.
As you may know, when you genotype or sequence data, you obtain genotypes, meaning you can’t determine whether a specific allele—like the one on rs15.19.3.1.18—came from your father or your mother.

Figure 1: A non copyrighted image that explains the difference between genotyped and phased dataset.
Some researchers discovered that it’s possible to infer haplotypes using the linkage disequilibrium (LD) pattern (yes, you can check off “LD” on your bingo card). Most statistical phasing methods take as input a set of genotypes (usually in VCF format) and a genetic map. You can also take advantage of reference panels with a large number of samples, especially if the panel has a good ancestry match with your population or includes high genetic diversity.
One important thing to mention: if you don’t have a sufficiently large sample size, avoid performing phasing without a reference panel. Without enough samples, the software won’t be able to accurately identify LD blocks, leading to poor phase inference.
The genetic map describes the position of genetic variants in centimorgans (cM) and base pairs (bp). The cM is a unit of measure for recombination—meaning that if two variants are 1 cM apart, there is a 1% chance that they will be separated during recombination.
In an ideal world, we could phase everyone using trios (mother, father, and offspring) since this approach significantly improves the accuracy of phased genotypes. Unfortunately, trio phasing is the exception rather than the rule, so we rely on complex statistical methods that infer haplotypes based on populational information. As with any inference, this approach comes with errors (as you can see in Figure 1).

Figure 2: The world if all phasing were done using trio phasing.

Figure 3: The trio phasing process. It’s easier to identify which parts were inherited from the mother and father.
My friend Victor Bord (from the University of Maryland) performed a basic analysis comparing SHAPEIT5 and Eagle2. According to his results, SHAPEIT5 outperforms Eagle2. I’ll probably ask him to write something about this so we can publish it here—since he’s not planning to write a paper or even a Twitter thread about this informal benchmark.
After phasing, you have the required data to perform haplotype-based analysis. Local ancestry (as mentioned in one of my previous posts) is an inference based on phased data. Another common inference is genotyping imputation, or simply imputation.
Fun fact: I’m a co-first author of the first Brazilian-based imputation panel (EPIGEN-Brazil Initiative resources: a Latin American imputation panel and the Scientific Workflow - PubMed). In this paper, we integrated 90 samples genotyped with Illumina Human Omni 5 (~5M variants) with 1000 Genomes data, demonstrating that this approach significantly improved imputation accuracy.
Luckily, today you don’t need to run imputation using your own panels and scripts because we have imputation servers. I’m a huge fan of TOPMed imputation because they offer a panel with 133,597 deeply sequenced samples that provide excellent genetic diversity for free. This makes it the best option for LARGE-PD data.

After imputing your data, some people like to perform QC on the imputed dataset. Personally, I don’t perform any QC besides checking the EmpRsq distribution. When you impute variants, each comes with a quality score (Rsq or R²), but this metric is calculated without considering the observed variants. EmpRsq, on the other hand, is different. It takes a typed variant, masks it, and imputes it. The software then compares the genotyped and imputed values, calculating a correlation. By looking at this statistic, you can assess the quality of the imputation.
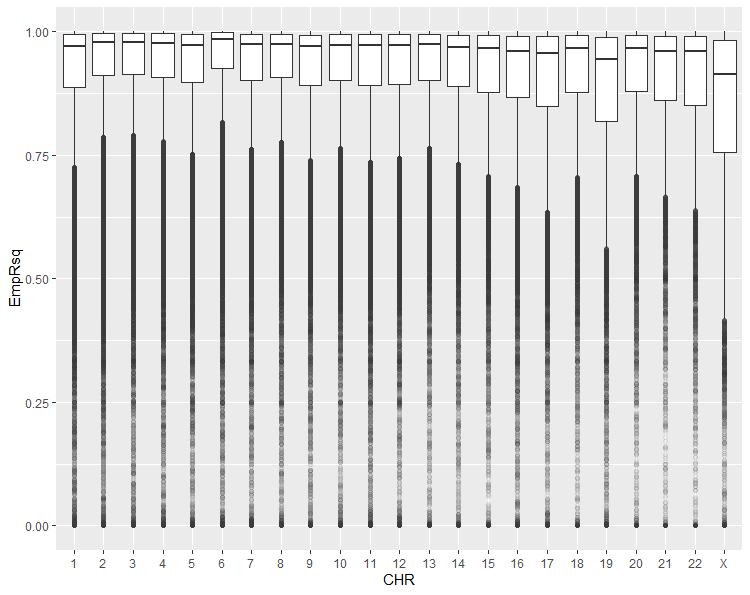
Figure 4: The distribution of Rsq for all chromosomes. The imputation on chromosome X is problematic and I will propably talk about X soon
Lower Rsq scores are associated with worse imputation performance, and this information can help you make adjustments to your analysis pipeline. For example, we applied a stricter Rsq cutoff in our X-Chromosome Wide Association Study because the EmpRsq on the X chromosome isn’t as good as it is for autosomes.
I think that’s all for today’s post. I’ll make another one soon since I didn’t post last month.
See you,
Thiago Peixoto Leal
P.S. Don’t mention Emilia Perez to Paula Reyes. She gets really mad about that movie.