Hello everyone,
Today I’m writing what is probably my easiest post so far because it’s about my own work.
All my previous posts took quite a bit of effort: I had to come up with ideas, double-check the content, and even run a meme review committee to make sure nothing was offensive.
But today is different. Today, I get to share some information about the research I’ve been working on for the past few years, which is now available as a preprint on medRxiv:
So let’s start.
As I mentioned in the first post of this series, there is a well-known lack of diversity in genetic studies and Genotype-Phenotype Association Studies in Parkinson’s Disease (PD) are no exception.
This lack of genetic diversity can limit our understanding of the pathogenesis of PD and cause us to miss important risk loci (as shown in studies like Rizig et al. (PMID: 37633302)). It also means that certain populations may be excluded from the benefits brought by precision medicine.
That’s where the Latin American Research Consortium on the Genetics of Parkinson’s Disease (LARGE-PD) comes in. LARGE-PD is an ongoing effort involving over 45 institutions across 15 countries in Latin America and the Caribbean. The goal is to address the lack of diversity in PD genetics by focusing on a population that, according to the GWAS Diversity Monitor, represents less than 2% of all participants in GWAS to date.

Figure 1. Print from the GWAS diversity monitor. Believe in me, we increased the genetic diversity n the past months (before European were > 95%)
Dr. Ignacio Fernández Mata established the cohort in 2005 and, since then, has invited collaborators from across Latin America to contribute. One of the aspects I most admire is that LARGE-PD avoids problematic scientific practices such as parachute science or scientific colonialism. The project actively supports the development of local infrastructure, assists with grant proposals, offers workshops, and provides scientific support to participating cohorts, encouraging them to lead and conduct their own research.

Figure 2. How I imagine the LARGE-PD invitation: You can live under the logic, I prefer the magic.
LARGE-PD is a project composed of two phases: Phase 1 focused on investigating the genetics of Parkinson’s disease (PD) in Latin American populations. It included genotyping 1,501 samples from Brazil, Chile, Colombia, Peru, and Uruguay. Data from this phase has been used in several publications, including Loesch et al. (PMID: 34227697, 35917738), Sarihan et al. (PMID: 33150996), and Leal et al. (PMID: 37469269).
Phase 2 aims to collect both genetic data and detailed demographic and lifestyle information from approximately 6,000 individuals across Latin America. In our current medRxiv paper, we analyzed ~4,400 samples from countries in South America (Argentina, Brazil, Chile, Colombia, Peru, and Uruguay), Central America and the Caribbean (Costa Rica and Honduras), and North America (Mexico and the United States).
The work I will present today is based on both datasets, using Phase 1 as the discovery cohort and Phase 2 as the replication cohort.
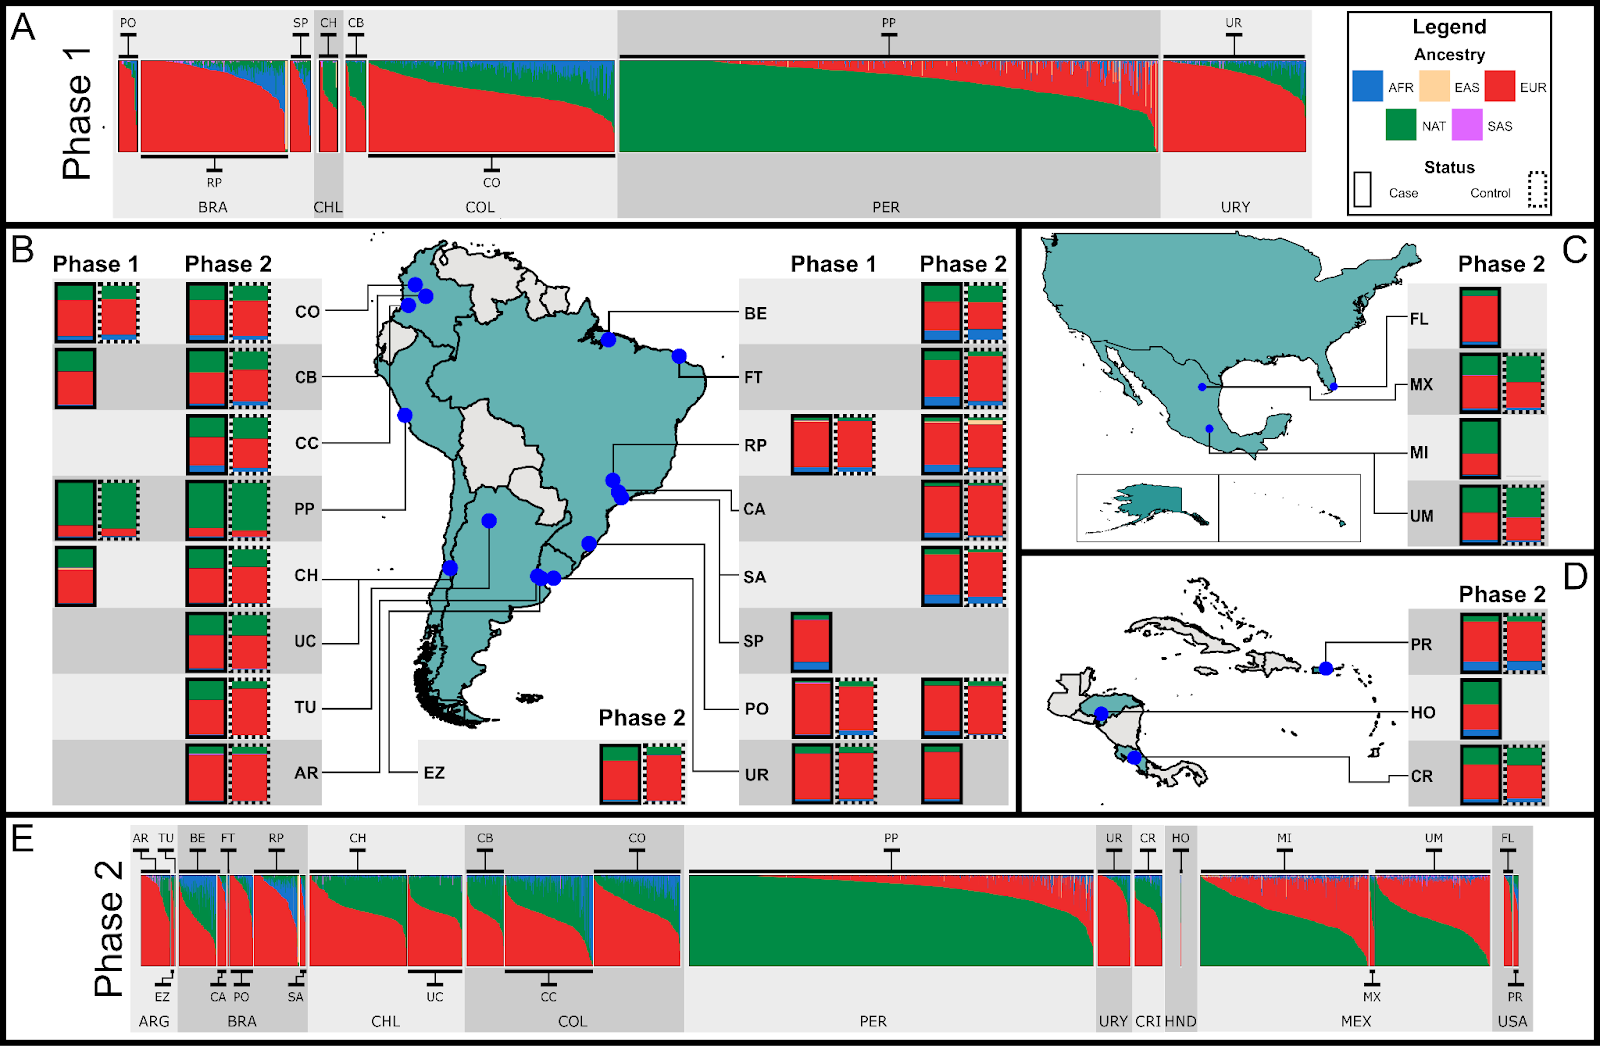
Figure 3. Beta version of the main figure from the preprint. For better detail, check out the version in the preprint (yes, that’s my plan: to get you to read it)
In this work, I applied everything discussed in the previous topics:
- Population genetics guided us through the complexities of working with underrepresented populations (link).
- “Hartl and Clark is my shepherd; I shall not want.”
- Quality control tailored for admixed samples (link).
- Ancestry inference, including PCA, global, and local ancestry (link).
- Phasing and imputation (link).
- Regression models for association testing (link).
- The main plot was created using the code from my tutorial:(link).

Figure 4. Thiago’s farming aura after revealing his plan (with the worse editing skills)
Let’s start with the fact that our data is somewhat heterogeneous. Traditional GWAS approaches, which we exclude related samples and running regression with age, sex, and principal components, are not sufficient for our study. We need to review the literature to identify methods better suited to handle our data’s complexity

We found a benchmark study comparing SAIGE, GMMAT, and TRACTOR for performing GWAS in admixed populations. SAIGE was identified as the best model for controlling type I error rate, while TRACTOR excelled at detecting ancestry-specific risk loci. However, in another “benchmark” (more of a scientific “diss track” written by Hou et al.) which the authors showed that other models were shown to have greater power than TRACTOR.
Since no federal law prohibits using more than one GWAS model in a paper, we decided to apply three: (i) SAIGE, which incorporates the relationship matrix to utilize all available samples; (ii) ATT, which includes global ancestry in the model to correct for population structure; and (iii) TRACTOR, which splits genotype dosage by ancestry, enhancing detection of ancestry-specific risk loci. Additionally, we performed admixture mapping, which is conceptually similar to GWAS but tests the association between local ancestry windows and the phenotype instead of individual SNPs. This approach reduces the number of independent tests, resulting in a less stringent p-value threshold for statistical significance.

Figure 5. That feeling when your p-value threshold jumps from 5×10⁻⁸ to 1×10⁻⁵.
We observed a consistent statistical association on chromosome 4 (near the SNCA gene) across all GWAS methods. However, other findings on chromosome 3 (near NRROS, identified by ATT), chromosome 11 (near SPATA19, ATT), and chromosome 13 (near UBAC2, ATT) were not replicated. Our admixture mapping identified two significant regions: chr1:242,089,864–243,560,064, associated with European ancestry, and chr6:165,474,043–167,351,763, associated with African ancestry. However, neither of these regions replicated in the independent cohort.

Figure 6. Manhattan plots for each GWAS approach and a meme to avoid wasting empty space. I don’t know why MyLocusZoom puts the wrong gene name to SNCA.
This moment was a very dark one. Since Loesch et al. 2021 we hypothetised that NRROS was associated with PD, everything makes sense, but looks that SNCA was our only replicated signal.

Figure 7. POV: You’re a postdoc, and the experiments refuse to give you new associated loci.
At this point, we decided to meta-analyze Phase 1 and Phase 2. This work was carried out by Dr. Juan Felipe Duarte-Zambrano using GWAMA (I’ll explain more about that in another post—this one’s already long!). All methods converged on the same result: SNCA and ITPKB.
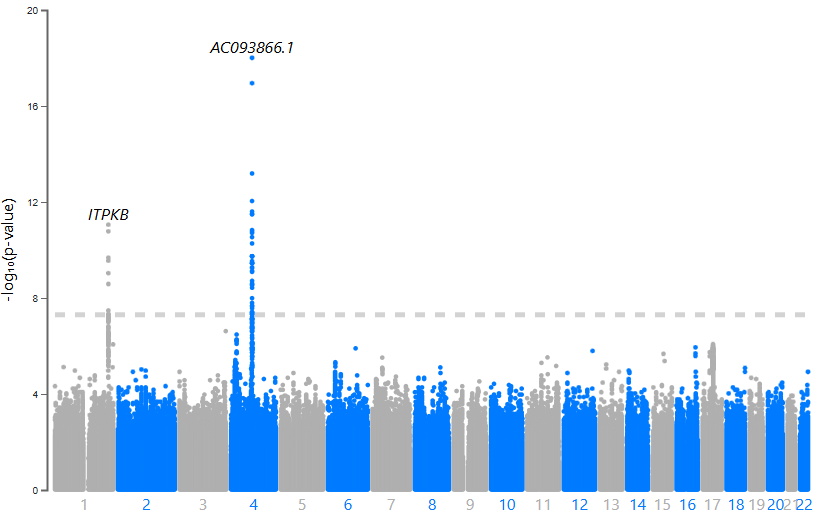
Figure 8. Manhattan plot for one of out meta-analysis
Previous studies suggest that ITPKB may play a protective role against α-synuclein aggregation, with expression levels positively correlated with α-syn. The lead SNP in ITPKB is particularly interesting: (i) It’s located in the 5′ UTR, (ii) SnpEff predicts a potential start codon gain, (iii) It has a CADD Phred score of 17.92 (placing it in the top ~3% of most deleterious variants), and (iv) A FORGE dbscore of 8/10 (it lost points only because there’s no known eQTL associated with this variant).
In the next posts, I’ll share some considerations about our meta-analysis, dive into local ancestry inference in LARGE-PD, and explain how the experience we’ve gained will be applied to GP2.
If you’ve read this far, I have one request: please like my X post about the preprint. There are several memes in the thread—but sadly, few people noticed that I wrote Splicer-Man in the first tweet ![]() . The plan is to increase the number of people who read the paper so I can gain citations, get invited to cool meetings, and gradually build a scientific reputation.
. The plan is to increase the number of people who read the paper so I can gain citations, get invited to cool meetings, and gradually build a scientific reputation.
“See you, Space Cowboy”

