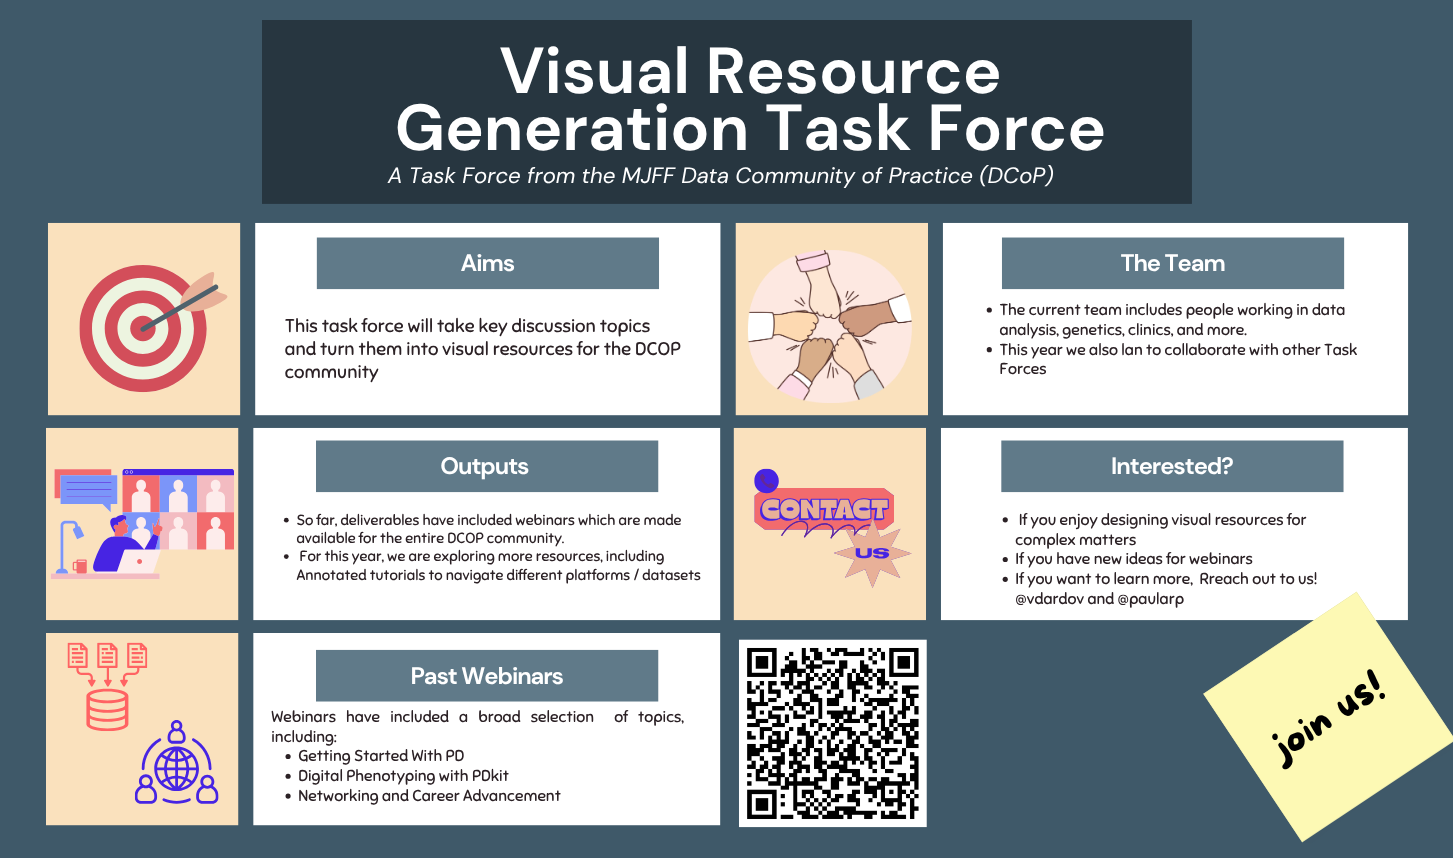
This task force’s objective is to produce visual resources that will aid researchers in comprehending the complex topics discussed in our community. And we are recruiting new members!
You would be joining us in designing, generating, reviewing and distributing resources such as webinars, tutorials and more.
Please contact us either through this post or direct message (@vdardov or @paularp) with any questions or suggestions!
Looking forward to working as a part of this team too! With more and more journals featuring graphical abstracts and research slowly becoming more accessible thanks to social media, I think developing strong visual resources to share our research and inform other researchers as well as the public is so valuable. Scientific communication, both verbal and visual, is a skill we’re not classically trained for but something we really need to prioritize to advance our field.
This looks great! One thought since you mentioned images as well. We could have some crossover with the Data Modality & Methodology Task Force, for a “graphical abstract” style figure for the homepage/README of a GitHub repo, or images for a web book such as the open science guide (we definitely talked about the benefit of potentially adding more figures to the web book) or the 2025 project turning the data wrangling guide into a book format.
Hello Task force members, I was busy getting married in the last month. I know there was a Google doc with action items. I would be happy to be pointed in its direction. I am here for any task force activity that needs attention in my purview.
Congratulations, @ekaamewu, hope everything went well!
I just shared the Google Doc with you! Let me know if you didn’t receive the email with the link. There are quite a few projects that are underway and/or still being designed, would be happy to have your feedback on.
If any other community members are interested in working on various visual resources for the PD community (or would like to suggest one), feel free to respond in this thread or reach out to the task force leads (@vdardov & @paularp) or me!
Yes, I have received the link to the spreadsheet. I have self assigned:
Research landscape heatmap and
Symptom wheel [self set deadline: Sep 30].
I assume no one else is working on these based on the assignee column. I’ll share updates on progress, and all interested are welcome to join me. Notes on the Infographics indicate that a lot exist already.
Hi @ekaamewu , thanks for signing up! In our shared notes doc, we actually did have some folks sign up for projects already, but they hadn’t made it over to that sheet yet. I’ve updated it now.
Symptom Wheel - Looks like @vcatterson and @anajimenahdz were interested in working on the symptom wheel as well, so maybe you can all join forces
Research Landscape Heatmap - @paularp also expressed interest!